
In May, the headlines promised a crash. The settled records have now caught up with the period since Budget night. They tell a quieter, more useful story. The last in a series of three, Mike Kaye, co-founder and director at Sarah Kaye & Co Buyers Agents, gives the verdict.
Start with the record, not the commentary
Begin with the only dataset in this debate that is neither a model nor a survey: the NSW Valuer General’s register of settled sales. It is every legally registered transfer in our suburbs, drawn from Land Registry Services.
It runs slow by design, because a sale only appears once it has settled and been registered, which is why we have counselled patience for two months. Our updated analysis of that register now takes in 94 registered post-Budget purchases across the core suburbs of the Upper North Shore.
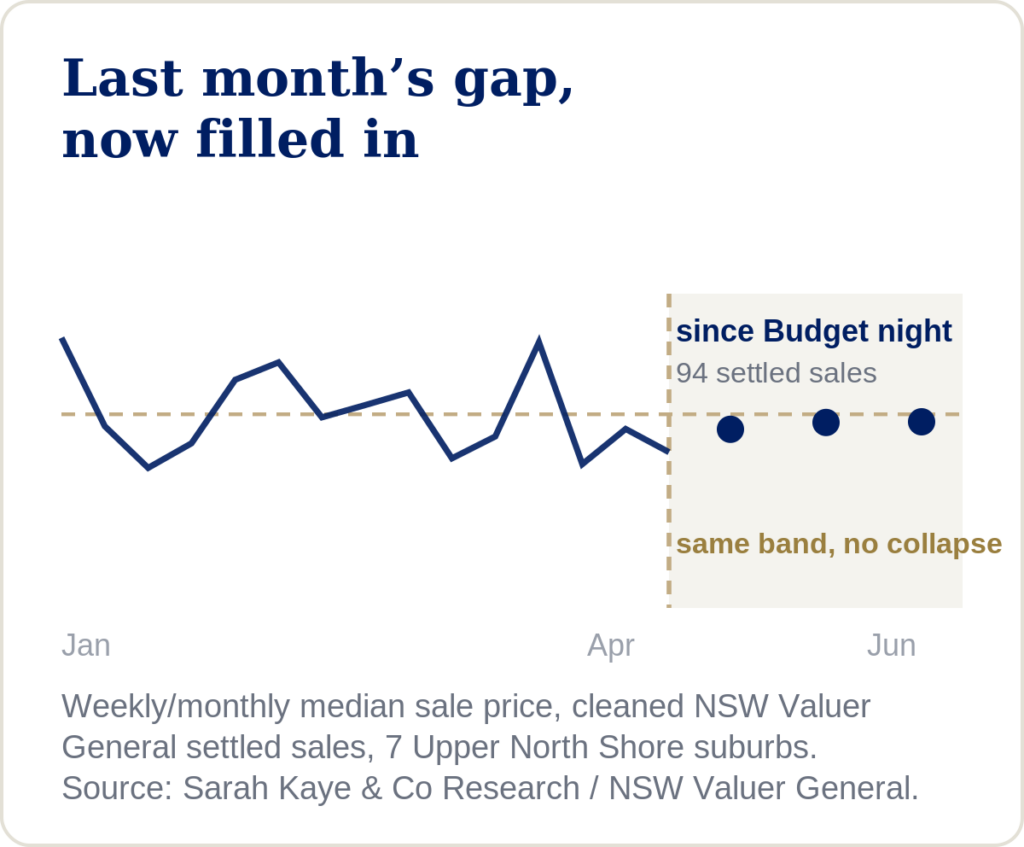
What do they show? Medians sitting inside the same band they occupied through summer and autumn. Sale by sale, suburb by suburb, there is nothing in the registered record that resembles the collapse forecast in the days after 12 May. That is not an interpretation. That is what is on the register.
A little cheaper, and it started before Budget night
The register tells you what sold and for how much. What it does less well, in markets as thin as ours, is compare like with like: the mix of homes sold swings a suburb’s median from month to month.
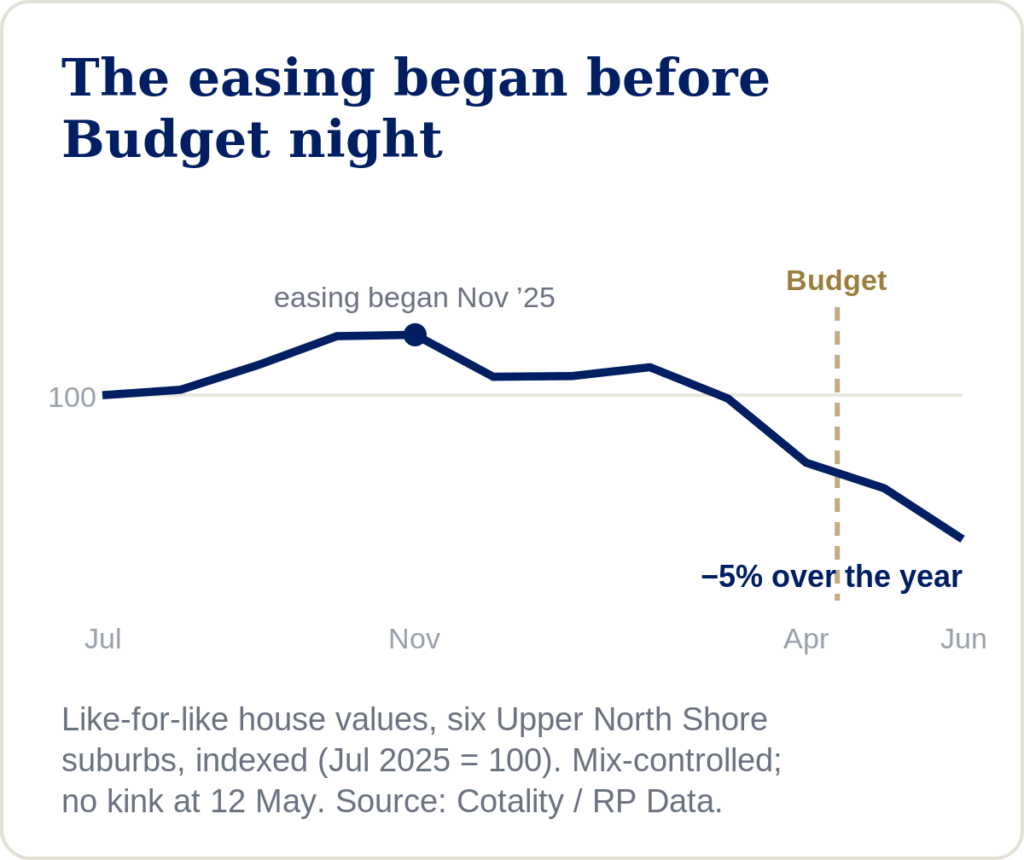
For that we lean on Cotality’s value series, which controls for the mix. Across Ku-ring-gai’s suburbs and Hornsby, it shows house values easing by roughly 2%-6% over the past year: Wahroonga toward the sharper end, Roseville Chase barely moving, Hornsby’s units actually firmer.
The number we put on the record
Two details matter more than the headline number. The easing began in spring (see chart on facing page): values across our patch peaked around November, half a year before Budget night. The steeper stretch began in March, before the Budget too. There is no lurch in the line at 12 May.
And it is a drift, not a drop: a few per cent over a year, after several years of strong growth. The tax changes did not cause this; at most they kept it company. That is what we argued in May, and the record now agrees.
Last month we did something commentators mostly avoid: we put a number on the record. Our sense, from the homes we had bought for clients, was that like-for-like prices sat around 5% below the previous quarter and that most of the adjustment was already baked in. We said the data would judge us. It has: the mix-controlled series lands within a whisker of that figure.
Still slower, and choice is returning
Days on market has kept stretching. A Gordon house now averages 90 days on the market; Pymble 83 days; Wahroonga 66 days (up from 47 days only a month ago). Even Hornsby, the affordable corner of the area that was still selling briskly in June, has slowed from 32 days to 56 days on the market.
On the sellers’ side, the picture has turned more interesting. Fresh listings remain scarce through the leafy centre of the district, but they have surged at the affordable end: Hornsby’s new listings have nearly doubled over two months, so more choice is arriving for exactly the buyers who have been most starved of it.
The auction circuit, for what it is worth, has now run cold for nine straight weeks; we give that metric as little weight as ever, but its direction merely confirms what the better data already shows.
It is worth noting the industry’s own history. The average Australian downturn of the past 30 years has run for eight months and cost about 3%; the average upswing that followed returned more than 30%. Short and shallow, then long and strong. Nothing suggests this cycle will be different.
You may have read that prices in Sydney’s affluent suburbs have fallen 4% or more in just two months, and that auction results are worse than during the pandemic.
The Upper North Shore is affluent by any definition, but neither the register nor the value series shows anything of the sort here: the two months since the Budget look like a 1%-2% decline – orderly, negotiated, unhurried.
The sharper falls are real, but they belong to other markets: waterfront trophy postcodes and the inner city, where prices flew highest and the buyer pool is thinnest.
Four groups. Four different effects.
Owner-occupiers have seen nothing change since May: the family home sits outside these reforms entirely. One independent researcher recently called it the last tax shelter; he is right.
Buyers, meanwhile, now have conditions that have quietly become the best in years: more time to decide, more room to negotiate, and now more stock arriving at the accessible end of the market.
For investors, the rotation the policy intended is visible and real: money is moving to new builds, and competition for established homes has thinned.
Renters are the group we would flag: the record rents nationally remain the numbers to watch. We expect modest pressure, which gives us no pleasure.
In May we said the Budget was not the biggest story. The settled record now agrees. In June we said slower, not cheaper – yet. The yet has arrived, quietly, at a few per cent, most of it in train before the Budget was ever announced.
A market that reprices modestly and keeps trading is a market doing its job, and right now it is treating prepared, well-advised buyers well. That is the story the data tells. It was never as loud as the headlines. It was just true.